Time Series Analysis - Lecture Note 2
- Kuntal Bakuli

- May 6, 2021
- 4 min read
Components for Time Series Analysis
The various reasons or the forces which affect the values of an observation in a time series are the components of a time series. The four categories of the components of time series are
Trend
Seasonal Variations
Cyclic Variations
Random or Irregular movements
Seasonal and Cyclic Variations are the periodic changes or short-term fluctuations.
Trend
The trend shows the general tendency of the data to increase or decrease during a long period of time. A trend is a smooth, general, long-term, average tendency. It is not always necessary that the increase or decrease is in the same direction throughout the given period of time.
It is observable that the tendencies may increase, decrease, or are stable in different sections of time. But the overall trend must be upward, downward, or stable. The population, agricultural production, items manufactured, number of births and deaths, number of industry or any factory, number of schools or colleges are some of its examples showing some kind of tendencies of movement.
Linear and Non-Linear Trend
If we plot the time series values on a graph in accordance with time t. The pattern of the data clustering shows the type of trend. If the set of data cluster more or less round a straight line, then the trend is linear otherwise it is non-linear (Curvilinear).
Periodic Fluctuations
There are some components in a time series that tend to repeat themselves over a certain period of time. They act in a regular spasmodic manner.
Seasonal Variations
These are the rhythmic forces that operate in a regular and periodic manner over a span of less than a year. They have the same or almost the same pattern during a period of 12 months. This variation will be present in a time series if the data are recorded hourly, daily, weekly, quarterly, or monthly.
These variations come into play either because of natural forces or man-made conventions. The various seasons or climatic conditions play an important role in seasonal variations. Such as the production of crops depends on seasons, the sale of umbrellas and raincoats in the rainy season, and the sale of electric fans and A.C. shoots up in summer seasons.
The effect of man-made conventions such as festivals, customs, habits, fashions, and some occasions like marriage is easily noticeable. They recur themselves year after year. An upswing in a season should not be taken as an indicator of better business conditions.
Cyclic Variations
The variations in a time series that operate themselves over a span of more than one year are the cyclic variations. This oscillatory movement has a period of oscillation of more than a year. One complete period is a cycle. This cyclic movement is sometimes called the ‘Business Cycle’.
It is a four-phase cycle comprising of the phases of prosperity, recession, depression, and recovery. The cyclic variation may be regular are not periodic. The upswings and the downswings in business depend upon the joint nature of the economic forces and the interaction between them.
Random or Irregular Movements
There is another factor that causes the variation in the variable under study. They are not regular variations and are purely random or irregular. These fluctuations are unforeseen, uncontrollable, unpredictable, and are erratic. These forces are earthquakes, wars, floods, famines, and any other disasters.
Check an example of time-series data
An example is a data set of the number of births per month in New York city, from January 1946 to December 1959 (originally collected by Newton). This data is available in the file http://robjhyndman.com/tsdldata/data/nybirths.dat .
The data looks like,
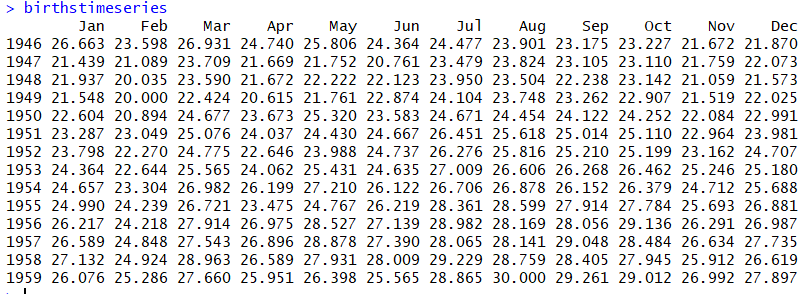
Now if we plot the data, it looks like;
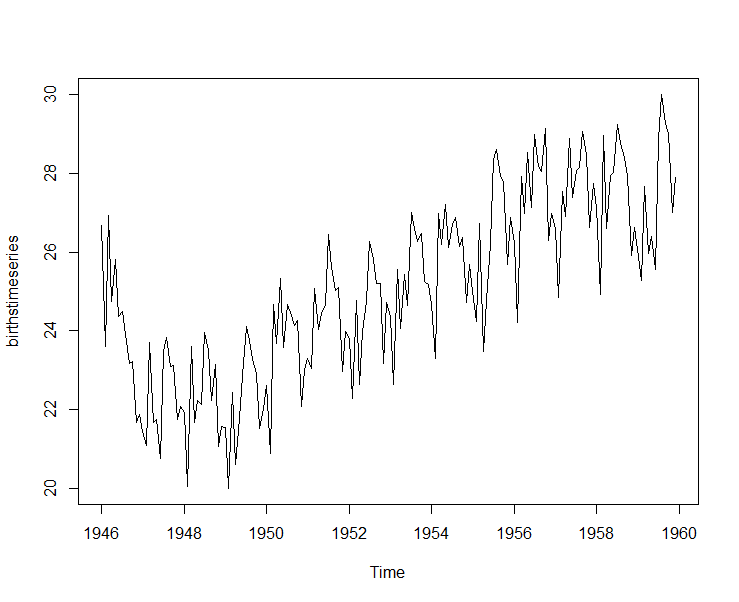
If we look at the graph, it is clear that the number of births is increasing over the years. This can be considered as the pattern of the whole data set. In time series analysis we call it, Trend of the data.
Now, If we look carefully then we find that within every year there are some fluctuations in numbers. Within any year the numbers are not thoroughly increasing. There are some periodic fluctuations, in time series analysis we call them Seasonal fluctuations.
Another example:
Mathematical Model for Time Series Analysis
Additive Model for Time Series Analysis
If y(t) is the time series value at time t. T(t), S(t), C(t), and R(t) are the trend value, seasonal, cyclic, and random fluctuations at time t respectively. According to the Additive Model, a time series can be expressed as
y(t) = T(t) + S(t) + C(t) + R(t). ......... ... (I)
This model assumes that all four components of the time series act independently of each other.
Multiplicative Model for Time Series Analysis
The multiplicative model assumes that the various components in a time series operate proportionately to each other. According to this model
y(t) = T(t) × S(t) × C(t) × R(t)................. .. (II)
Note: Take the log of equation (II), you will get equation (I)
Few commonly asked questions:
Question: For which type of data the seasonal fluctuations do not appear in a time series?
Solution: The seasonal variations do not appear in a series of annual data.
Question: What is the difference between Seasonal fluctuation and Cyclical fluctuation?
Solution: Seasonal fluctuation and Cyclical fluctuation both are periodic fluctuations. Seasonal fluctuation is observed over a period of 12 months and cyclical fluctuation is observed over a period of a few years.

Comments