Time Series Analysis - Lecture note 5
- Kuntal Bakuli

- Jun 8, 2021
- 3 min read
Updated: Mar 24, 2022
The measure of Seasonal Indices
1) Ratio to trend method:
This method is an improvement over the simple averages method and this method
assumes a multiplicative model i.e
Y(t)= T(t). S(t). C(t). I(t)
The measurement of seasonal indices by this method consists of the following steps.
Step 1 - Obtain the trend values (for each time point, e.g. quarters)by the least square method by fitting a mathematical curve, either a straight line or second-degree polynomial.
(Note:
A. Obtain trend equation for annual data
B. If your data set is quarterly data then from the trend equation obtained for annual data, find quarterly increments.
C. Be careful when you are obtaining the trend value for each data point, remember your annual trend equation gives you the formula to get the annual trend value.)
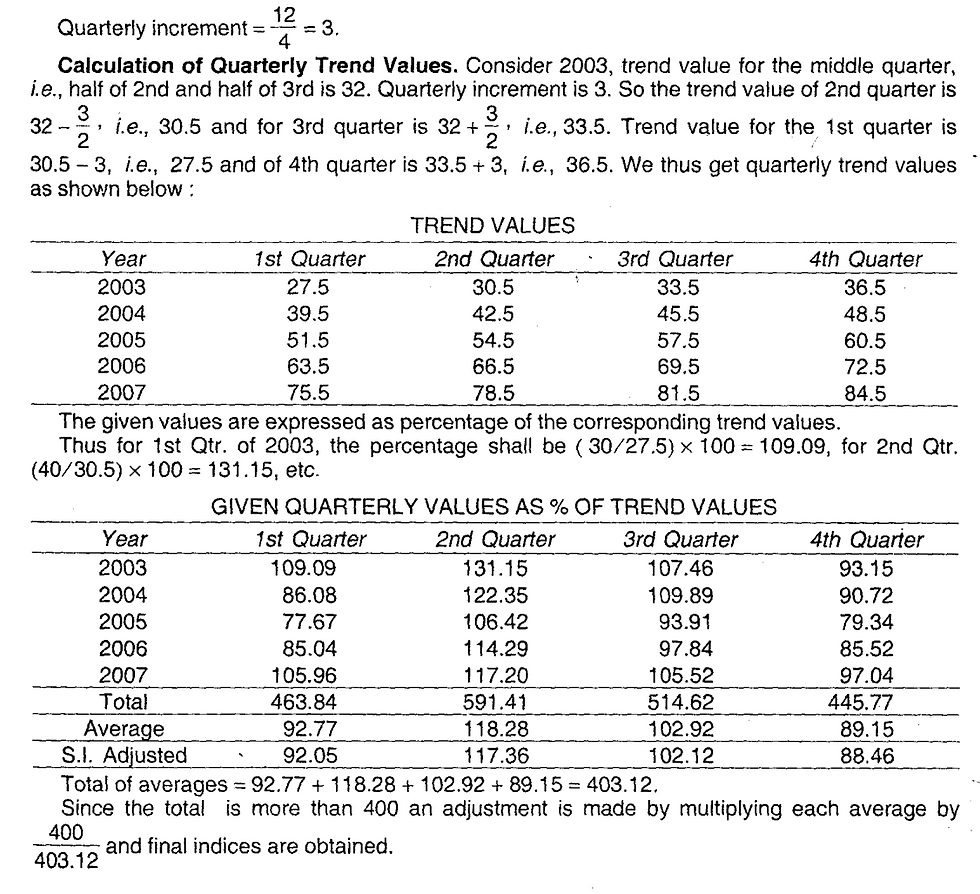
Step 2- Express the original data as the percentage of the trend values. Assuming the
multiplicative model these percentages will contain the seasonal, cyclical and
irregular components.
Step 3- The cyclical and irregular components are eliminated by averaging the percentages for different months (quarters), thus leaving us with indices of seasonal variations.
Finally, the indices obtained in step(3) are adjusted to a total of 1200 for monthly
and 400 for quarterly data by multiplying them throughout by a constant K which is given by,
For Monthly data,
For Quarterly data,
Advantages:
1. It is easy to compute and easy to understand.
2.Compared with the method of monthly averages this method is certainly a more logical procedure for measuring seasonal variations.
3.It has an advantage over the ratio to moving average method that in this method we obtain ratio to trend values for each period for which data are available whereas it is not possible in ratio to moving average method.
Disadvantages:
The main defect of the ratio to trend method is that if there are cyclical swings in the series, the trend whether a straight line or a curve can never follow the actual data as closely as a 12- monthly moving average does. So a seasonal index computed by the ratio to moving average method may be less biased than the one calculated by the ratio to trend method.
Example:
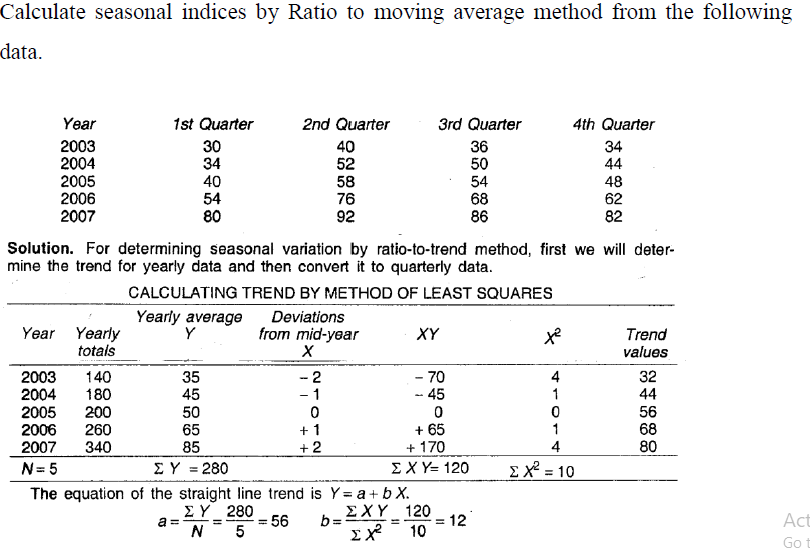
In this example, we have obtained a trend equation on annual data. We have obtained quarterly increments. Then from the annual trend value for each given year, we have carefully obtained the quarterly trend values. What if we obtain the trend equation on quarterly data? - what's wrong with it? Because if we do so it will save a lot of time and things will remain simple.
2) Ratio to Moving Average
The ratio to moving average method is also known as the percentage of moving average
method and is the most widely used method of measuring seasonal variations. The steps
necessary for determining seasonal variations by this method are
Step 1 - Calculate the 12-monthly moving average (or 4-quarterly moving average) of the given data. These moving averages values will eliminate Seasonal fluctuations and leaving us with Trend and Cyclical components.
Step 2- Express the original data as percentages of the centered moving average
values.
Step 3- The seasonal indices are now obtained by eliminating the irregular or random
components by averaging these percentages using A.M.
Step 4- The sum of these indices will not, in general, be equal to 1200 (for monthly) or
400 (for quarterly). Finally, the adjustment is done to make the sum of the
indices to a total of 1200 for monthly and 400 for quarterly data by multiplying them throughout by a constant K, the values of K is mentioned in the previous section - "Ratio to trend method".
Advantages:
1. Of all the methods of measuring seasonal variations, the ratio to moving average method is the most satisfactory, flexible, and widely used method.
2.The fluctuations of indices based on the ratio to moving average method is less
than based on other methods.
Disadvantages:
This method does not completely utilize the data. For example in the case of 12-monthly moving average seasonal indices cannot be obtained for the first 6 months and last 6
months.
Example:

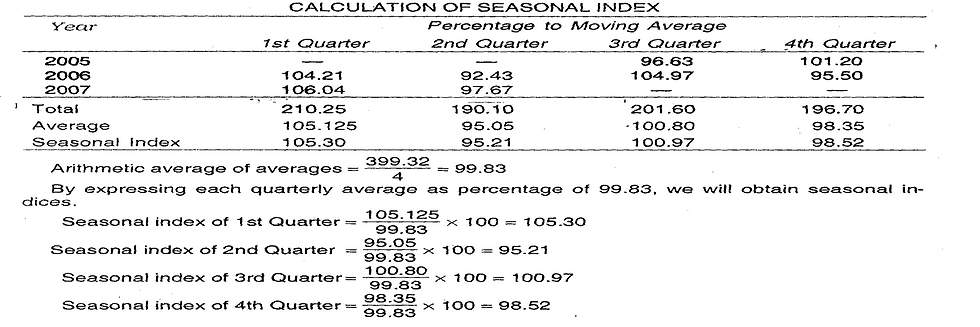
Note: When you take 4 points moving total or 12 points moving total, then don't forget to consider one additional column to take 2 points moving total. Otherwise, you get the values over the time points which are not mentioned in the given data set.

Comments